UML Diagrams
Stands for Unified Modeling Language. Used to model software solutions, application structures, system behavior and business processes.
UML Diagram Types
Structure Diagrams:
Behavioral Diagrams:
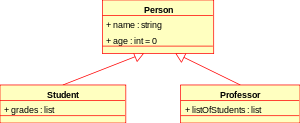
Class Diagram
Used to represent a collection of classes.
Structure:
- box:
- name of class
- attributes of class
- methods of class
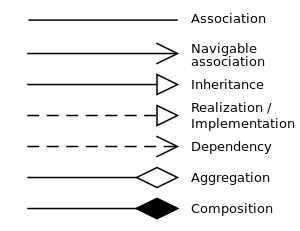
- arrows: relationship between classes

Relationship notations

Use cases:
- scope out small ideas before coding
- get early feedback of implementation
Activity Diagram
Used to represent process flow
Structure:
- stadia: actions
- diamonds: decisions
- bars: start or end of concurrent activities
- black circle: start of workflow
- encircled black circle: end of work flow
 Use cases:
 - showcasing work to non-technical colleagues
- address / outlines business requirements
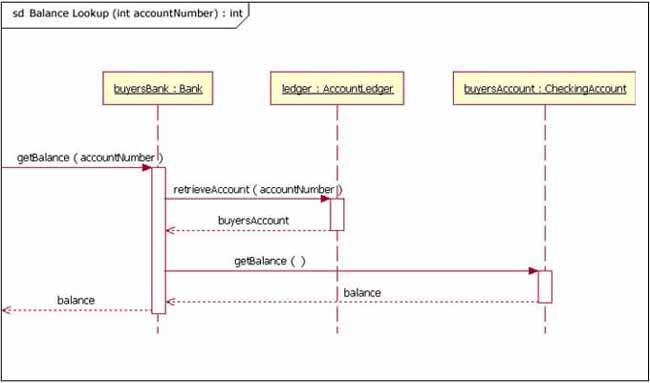
Sequence Diagram
Shows interactions between classes and system
- typically higher level than class diagrams
Structure:
- Top box: class or object
- Dashed line (Lifeline symbol): represents passage of time
- Empty boxes (Activations): represents the time needed for an object to complete a task
- Solid arrowhead, solid line: synchronous message
- Lined arrowhead, solid line: asynchronous message
- Lined arrowhead, dashed line: asynchronous return message / reply message
- Lined arrowhead, dashed line with <<create>> symbol: asynchronous return message


Sources: